Multidimensional data model
Before analyzing a data, we must first treat it and store it somewhere, however, depending how that data is stored it can become a long-term problem, such as high maintenance and data processing costs, contained therein or even useless data that is just wasting our money on storage and processing.
For this, we must organize our data before passing it on to our Data warehouse, one of the solutions is the multidimensional data model, however, every way, however here are some concepts that you will need to know beforehand.
OLAP
Or “Online Analytical Processing” is a tool used for the analysis and treatment of data in real time, widely used to treat a massive amount of information in the various dimensions of a data warehouse.
Example: We are analyzing temporal data and we want to have views by year, day, quarter or semester, this interaction with the user is done by OLAP.
OLTP
Or “Online Transaction Platform”, refers to systems that record all the operational actions of a stock, guaranteeing its success.
This type of data is generated massively every day
Example: a bank transaction for example, if it fails the whole action must be reversed, if it is successful, it must be recorded and immutable.
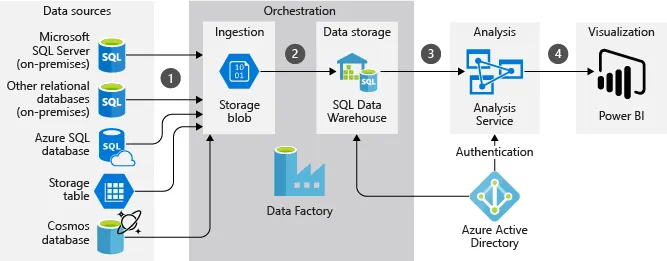
Data warehouse
This is a database for analysis only, think of it as a copy of the operational database but optimized (let’s talk about it soon) for business intelligence.
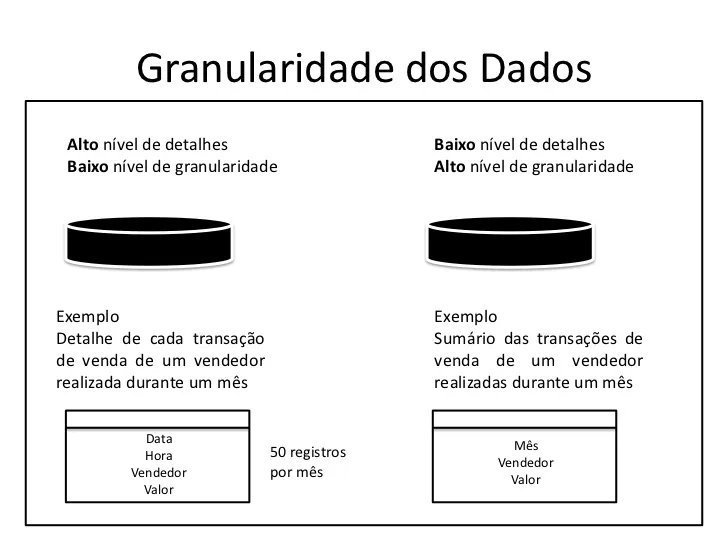
Data granularity
We must pay close attention to data granularity as it directly affects the volume in data storage and the speed of search and the level of detail of the information. In a brief explanation, when we have a high granularity of data it means that we have less details of the data, when we have a low granularity, we have more details of the data.
Example: Imagine that we have a sales table where the name of salespeople appears repeatedly. This table has a low granularity because it has a lot of information, so much information that it can make it difficult for us to select which salesperson had the highest number of sales, note that the more decentralized data we have in a table, the greater the data and therefore we will have longer analysis time. If we have a table of sellers with the total sales of each one, we will have data with less details, more granularity and spending less resources.
We can also understand this condensation and detailing as Drill Down and Drill UP.
Drill Down — the granularity is reduced and the level of details is increased.
Drill UP — the granularity is increased and the level of detail is decreased.
Therefore, it is clear that we must condense some data to avoid redundancy, save processing and space. We should think about Resources X Data = Information, if our data is poorly modeled we will throw away resources that are precious, so our equation looks like this Resources X Data = waste of time and money.
Multidimensional data Analysis
In this analysis we use structured data in the form of a cube (each side of the cube is a dimension), the multidimensional model is the standard in the analysis tools, for example, when we use arithmetic queries with OLAP. This model has a higher performance in queries, besides providing a facility in the creation of complex query’s.
When the scope of the project is reduced, this model allows a more agile implementation.
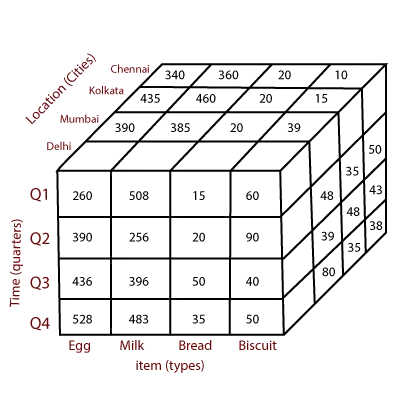
Structure
To visualize this model we use a cube, where tables are associated, summarized or aggregated to return some metrics (sales per year, for example). Each table is seen as a dimension, together they form a cube that can have low or high granularity, always depending on the requirements of each project.
Data cube is a data structure for storing and analysing large amounts of multidimensional data (Pedersen, 2009b).
Fact Tables
Fact tables are objects to be analyzed, composed of measures, contexts of each dimension and Foreign Keys, used to link the dimensions to that table.
Example: In our data warehouse we need to create a sales fact table, for this, we have structured it as follows.
The dimensions that will compose our suit are:
Time dimension
Geographic dimension (location)
Product dimension
Product type dimension
The layer will have the Foreign Key for each dimension plus the metrics, such as “total_sales”.
Types of Multidimensional Models
Star layout
It is the simplest model, where the fact is centralized and composed of dimensions with a large number of data, given that, without redundancy, these dimensions are directly linked to the fact through its Foreign Keys.
Snowflake layout
It is an extension of the star schema, composed of more dimensions reducing redundancy, in the end, we have a greater number of dimensions forming more complex queries and reducing performance.
Models such as the snowflake are arranged so that at each end of the star, it becomes the center of another star (MACHADO, 2013).
Constellation scheme
Or Fact Constellation, is a grouping of dimensions with multiple fact tables, its only disadvantage is due to the complexity.
I hope I have briefly explained why we should treat our data, what the consequences of these treatments are and presented all the main concepts successfully, thanks for your attention.
Thanks, bye!